
Focus Point’s Remarkable Per-Store Performance
By Handzalah / Black Swan Research 24 October 2026, 11:55pm MYT

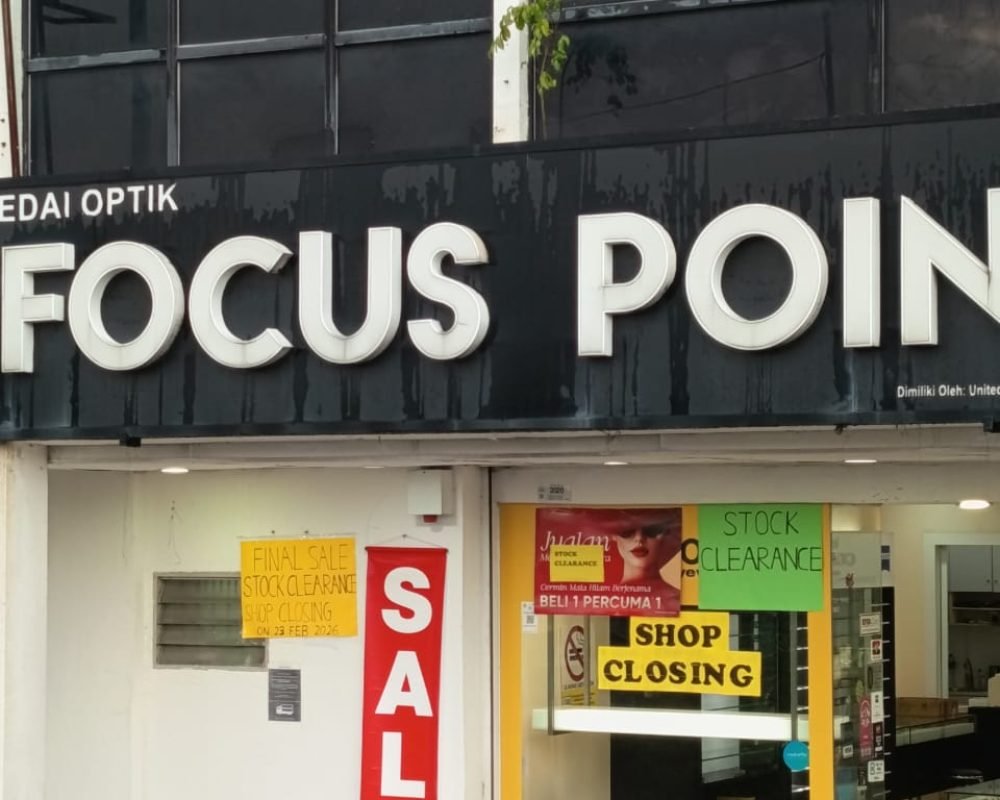


The pictures above was taken by Amru
how can we evaluate a retailer's efficiency?
I have this fascination for studying retailers and how they work as a business. Hence, I keep on writing up on Focus Point. Today’s small post will be on Focus Point’s 15 years analysis on per-store data and how economies of scale affected their business.
There are many ways in analyzing a store’s efficiency, like cash conversion cycle, inventory turnover, operating expense as percentage of revenue, and much more. However, today I want to share one of my favorite ways of analyzing a retailer. It is to analyze them on a per-store basis. Are they able to produce a higher per-store revenue and profit over time.
And near the end of the post, I would like to share on what it takes for Focus Point to be a 5-bagger, or make you 5 times your investment in the span of 10 years.
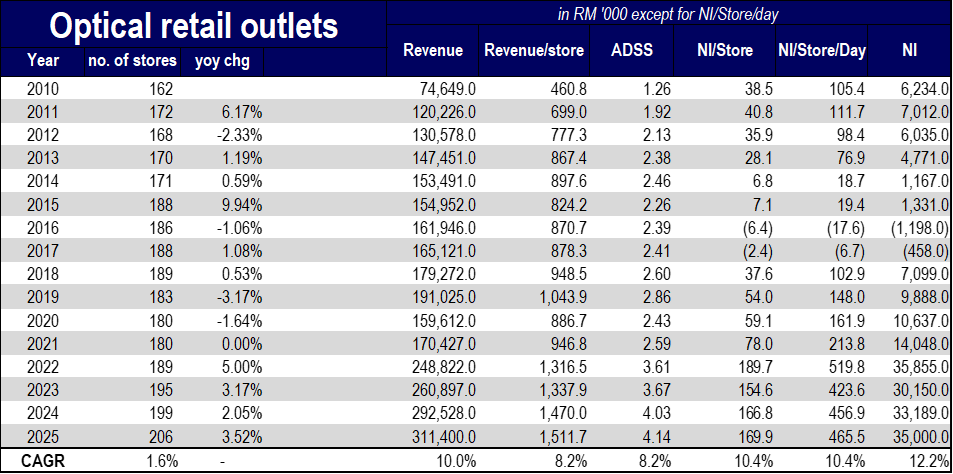
I will analyze Focus Point based on the 15-year period between 2010 and 2025. On the left of figure 1.0, you can see that the number of Focus Point stores grew at a compounded annual growth rate (CAGR) of 1.6%. Despite the rather low store count growth, their revenue for the same period increased at a CAGR of 10%. This shows that there has to be increased revenue per store. This slow growth in store count is a stark difference from ECOSHOP’s growth in store count. Retailers can differ in how they approach growth. In the case of Focus Point, what we can assume is that over the years, their refurbishment and optimization of underperforming stores, may have led to an increase in revenue per store. With refurbishment and optimization, store count do not go up, however, their revenue per store does, which leads to another way a retail can expand. It seems that this method of doing business, yielded pretty decent results.
Now to evaluate Focus Point’s per-store data. Revenue divided by store count, or revenue/store, has grown a respectable 8.2% CAGR in the 15-year time period. This is in contrast to the 10% CAGR in group revenue. But combine the 1.6% annual growth in store count and the 8.2% annual growth, you get a 10% annual growth in group revenue.
Their average daily store sales (ADSS) increased from RM 1,260 to RM 4,140, a CAGR of 8.2%. However, their net income per store per day, or NI/store/day, has performed marginally better at a CAGR of 10.4%. In 2010, an average Focus Point outlet would make RM 105.4 of net profit per day. Fast forward, to 2025, an average Focus Point outlet can squeeze out RM 465.5 in net profit per day. The most right column shows the net income, resulting from a 1.6% annual growth in store count combined with a 10.4% annual growth in per store net income. Net income grew a whopping 12.2% CAGR for the 15 years. This is quite impressive for a retailer who only grew their store count by 1.6%.
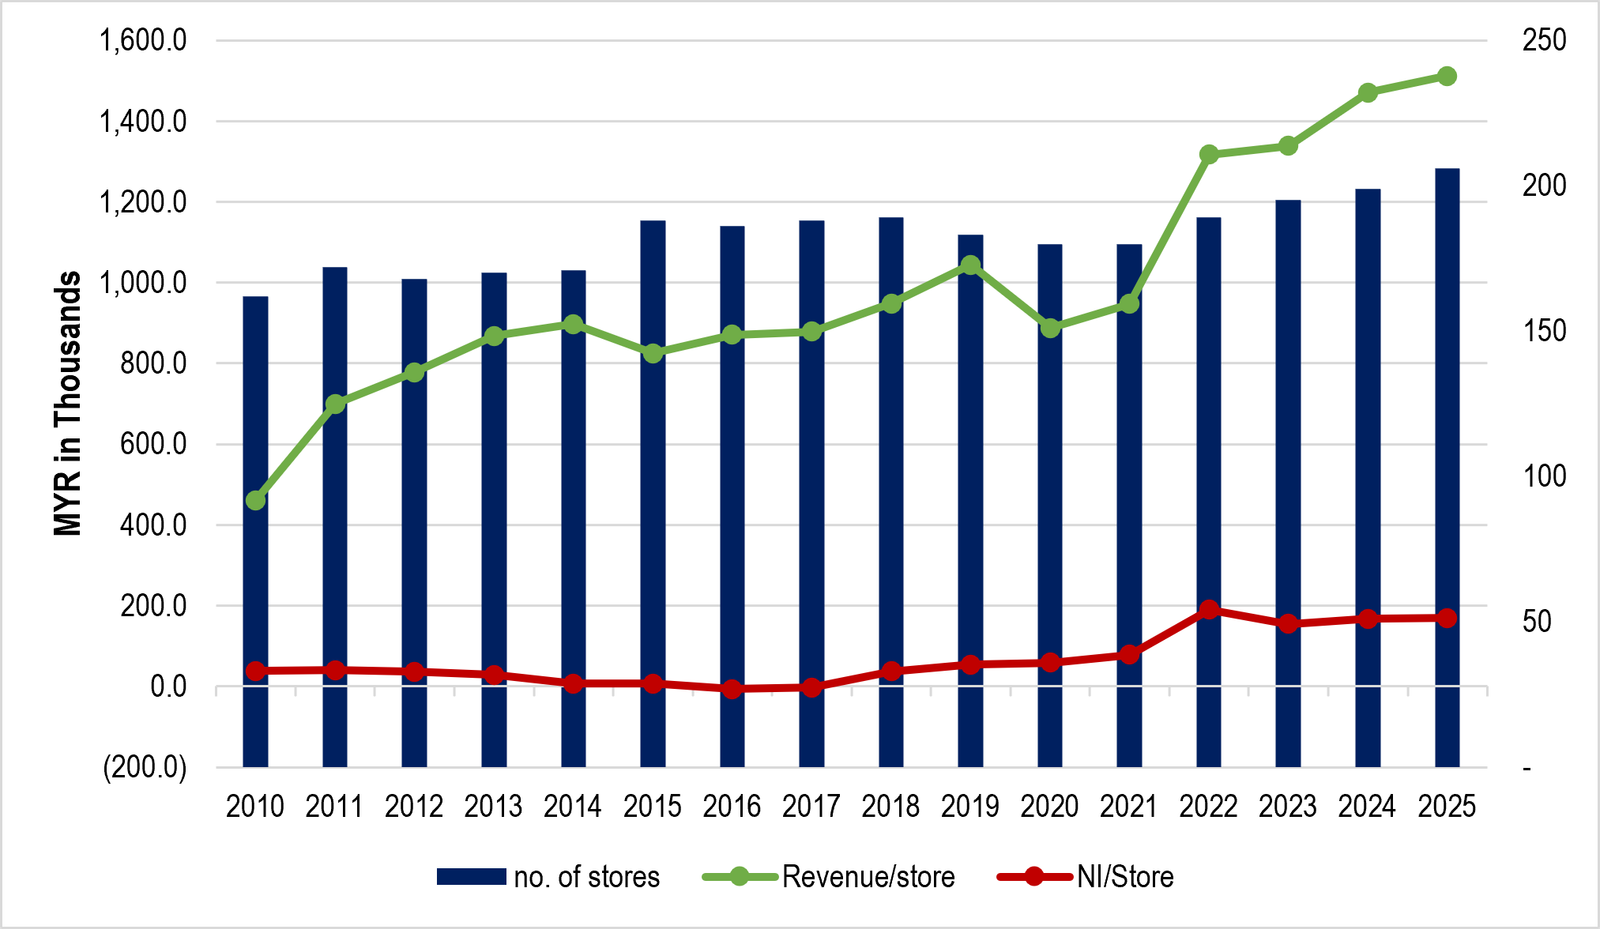
Figure 1.1 helps visualize the per-store data above. Despite the relatively flattish number of stores, the revenue per store, revenue/store, grew by 3.3x. And net income per store, NI/store, grew by 4.4x.
This further proves that their model works as a slow store count growth retailer. They can compound net income at a decent rate despite only opening 44 stores over the span of 15 years. That’s an average of approximately, 3 stores a year.
what does it take for focus point to be a 5-bagger in 10 years??
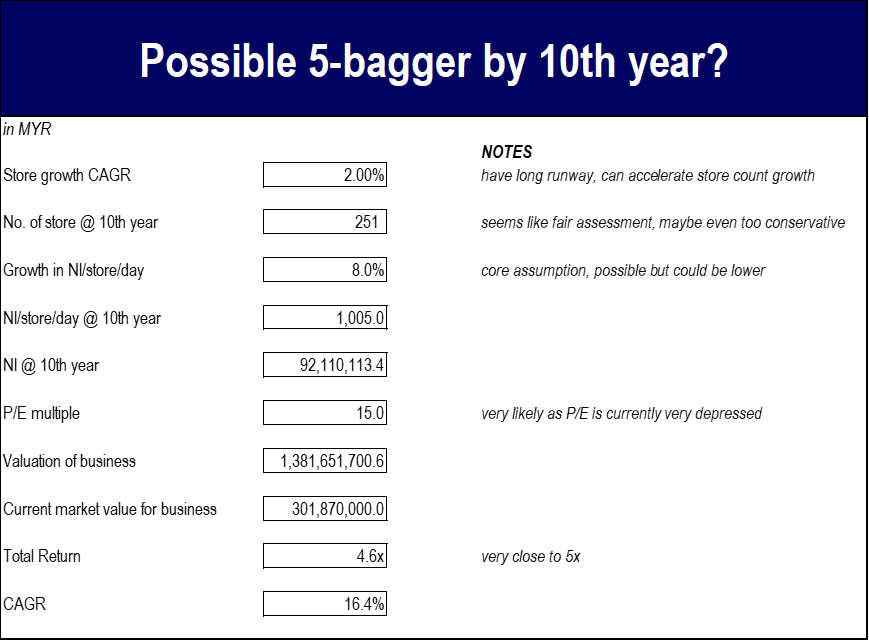
Figure 1.2 summarizes what assumptions must be fulfilled in order for an investment in Focus Point shares to yield a 5x return. Currently, the stock bobs around RM 0.495 per share, equivalent to a market capitalization of RM 301.87 million.
Let me walk you through my assumptions. I assume that their bakery business will be negligible and give zero contribution to the group’s net income.
First, I assume that Focus Point can slightly accelerate their store growth to 2% for the next 10 years. This is because Dato’ Liaw Choon Liang, Focus Point’s CEO, has in the past reflected his optimism in the untapped market of few regions within Malaysia. This can be the cause for a reacceleration in store count growth. Overall, this assumes that over the 10 years, Focus Point will add 45 new stores, resulting in a total store count of 251.
Now moving to the core assumption of growth in net income per store per day, NI/store/day. Assuming their refurbishments and optimization of existing store strategy remain strong for the next 10 years, Focus Point may see a 8% CAGR in NI/store/day. This results in the average Focus Point store earnings RM 1,005 per day in net profit in the 10th year. I believe that if they continue to do their magic, they can realize this 8% CAGR in NI/store/day.
The current P/E is around 8-9x after-tax net income. Therefore, an assumption of P/E expansion to 15x is a material assumption. However, I believe that Focus Point can reach this valuation as they will have a more quality business 10 years in the future. Their economies of scale will improve with their growth in store count. They can get rebates due to higher quantity purchases from their suppliers. This is why I believe that Focus Point deserves a higher P/E ratio in the coming future.
Now, take the 15x P/E and multiply it with net income at 10th year of RM 92.1 million (RM 1,005 <NI/store/day> * 251 <store count> * 365 <days in a year>= RM 92.1 million <net income>). This results in a valuation of Focus Point at RM 1,381.7 million or RM 1.38 billion. This is approximately 4.6x the current market valuation of RM 301.9 million. This is quite close to the 5x in 10 years target. This means, if assumptions above are true, your investments will grow at a CAGR of 16.4% for the next 10 years. Which means, a RM 1,000 investment in Focus Point today, may yield a market value of RM 4,600 in the next 10 years.
This is all just estimates that allow us to gauge the potential for Focus Point to yield great returns for its investors. This is no financial advise. I may add more example of per-store analysis for other retailers such as ECOSHOP in the near future.