
SAL: Delivering Impact Though Warehousing Expansion
By Handzalah / Black Swan Research 17 September 2026, 2:15am MYT

Sal saudi logistics services overview
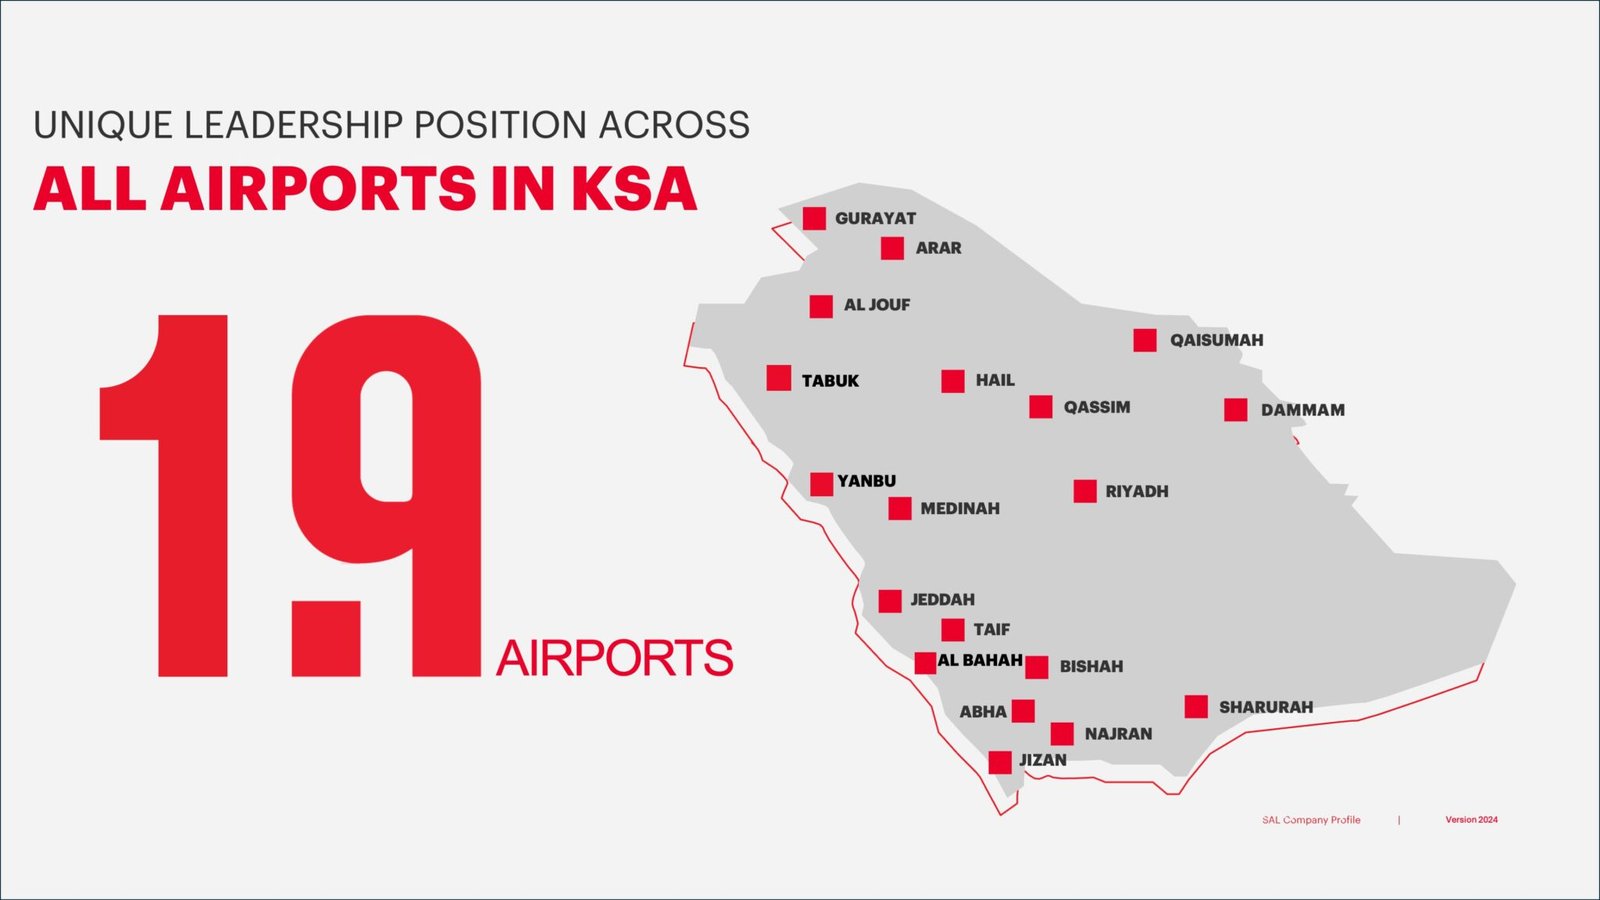
SAL is a logistic national champion in the Kingdom of Saudi Arabia. They have the primary business of ground handling for air cargo carriers. This means they have airport terminal concessions. Prior to the crave out in 2019, SAL was under Saudia Cargo. SAL went public on November 2023 at SAR 106 per share (around SAR 8.4 billion in market capitalization). Even after the IPO, Saudia (their parent company, a government entity) still owned 49% of SAL’s outstanding shares. Their business span over 19 airports in the Kingdom. And recently, Belgium was added to their portfolio through the acquisition of Aviapartner. Figure 1.0 shows the different airports they operate in within KSA.
Prior to GACA’s liberation of the airport operator market, SAL was the sole provider for air cargo ground handling services. However, entrants such as SATS has since entered the market thereby elevating the total logistics market value and allowing the Kingdom to play a more important role as a global logistics hub. Relying on only SAL constraints Saudi’s ability for growth in the Kingdom’s logistics market as SAL has limited capital to fund growth in infrastructure. On March 2025, SAL launched a new division or business segment. Named SAL Zones, SAL plans to invest SAR 4.1 billion in this project in order to increase warehouse supply in a market where there is chronic undersupply of warehousing space.
Sal zones overview
SAL Zones is an initiative that spans an area of ~1.5 million square meters (sqm), roughly 210 football fields, that encompasses the strategic role of Saudi as a logistics hub. The initiative is estimated to be revenue generative by around 2028 to 2030 where completion of all phases of the construction is expected to be around 2030. SAL Zones will have Class A warehouses. Class A warehouses is a relatively new development within KSA and SAL is pioneering in this field as they position themselves to benefit from the chronic undersupply of Class A warehousing. Figure 1.1 shows where that SAR 4.1 billion will be put to work. The land is leased in Falcon City in Riyadh. Since Saudi’s Class A warehouse is scarce, we can assume that rental rates for such warehousing will be greater than the current average warehouse rental rates. The premium is also because SAL Zones is focusing on Build-to-Suit (BTS) warehouse solutions whereby SAL tailors the need of the customer by incorporating customized warehouse design. This also builds a long-term relationship between SAL and its customers, lowering vacancy rates and enabling the company scale their operations without risks of insufficient cash flows.
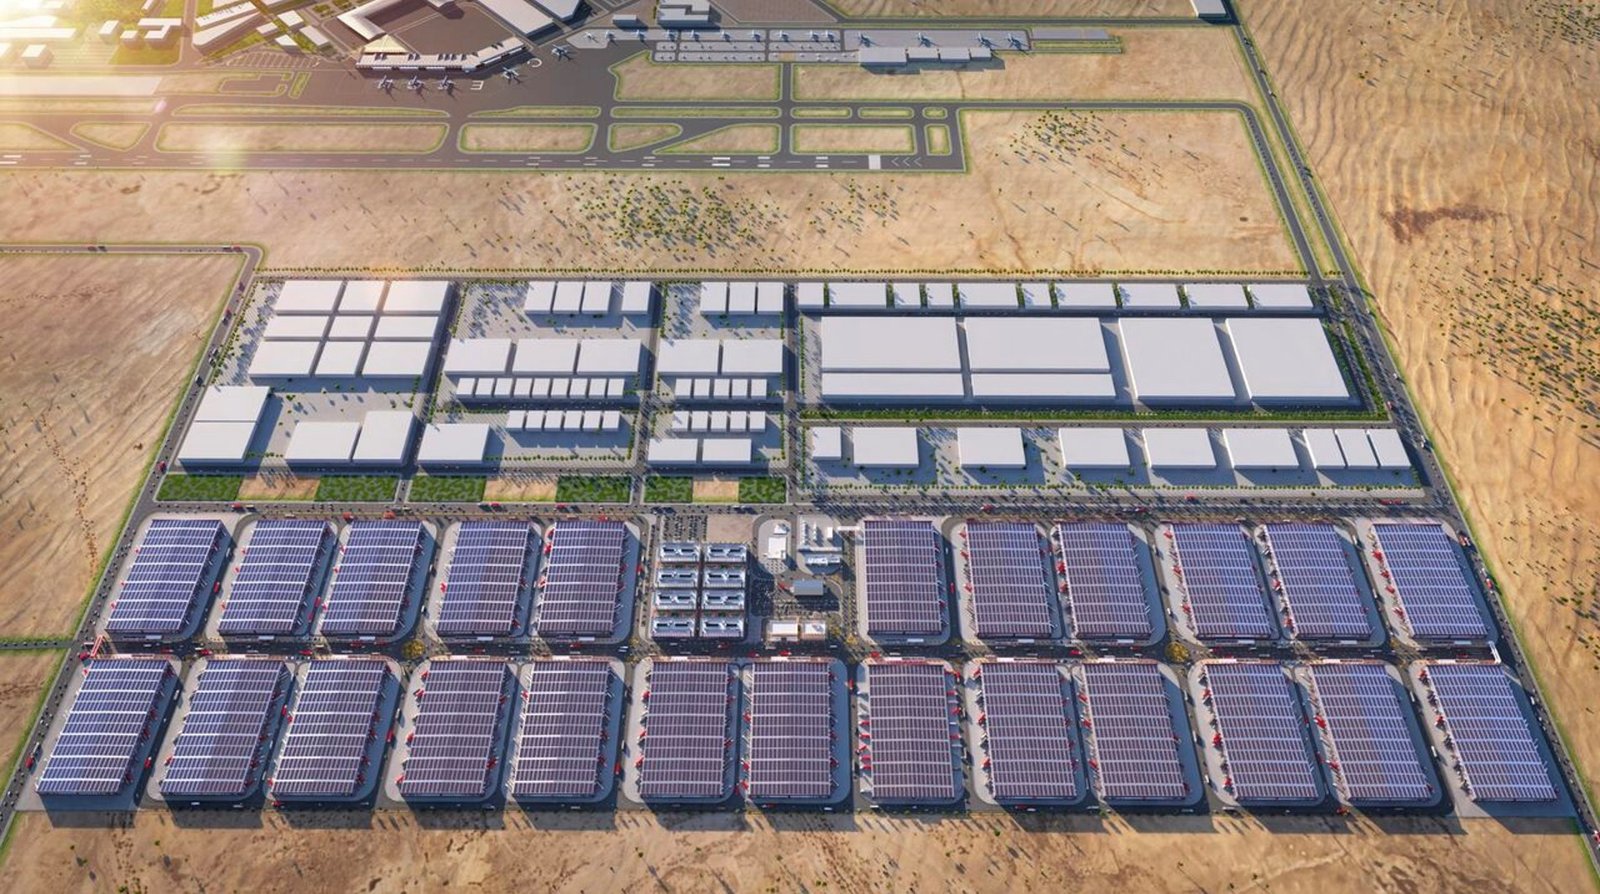
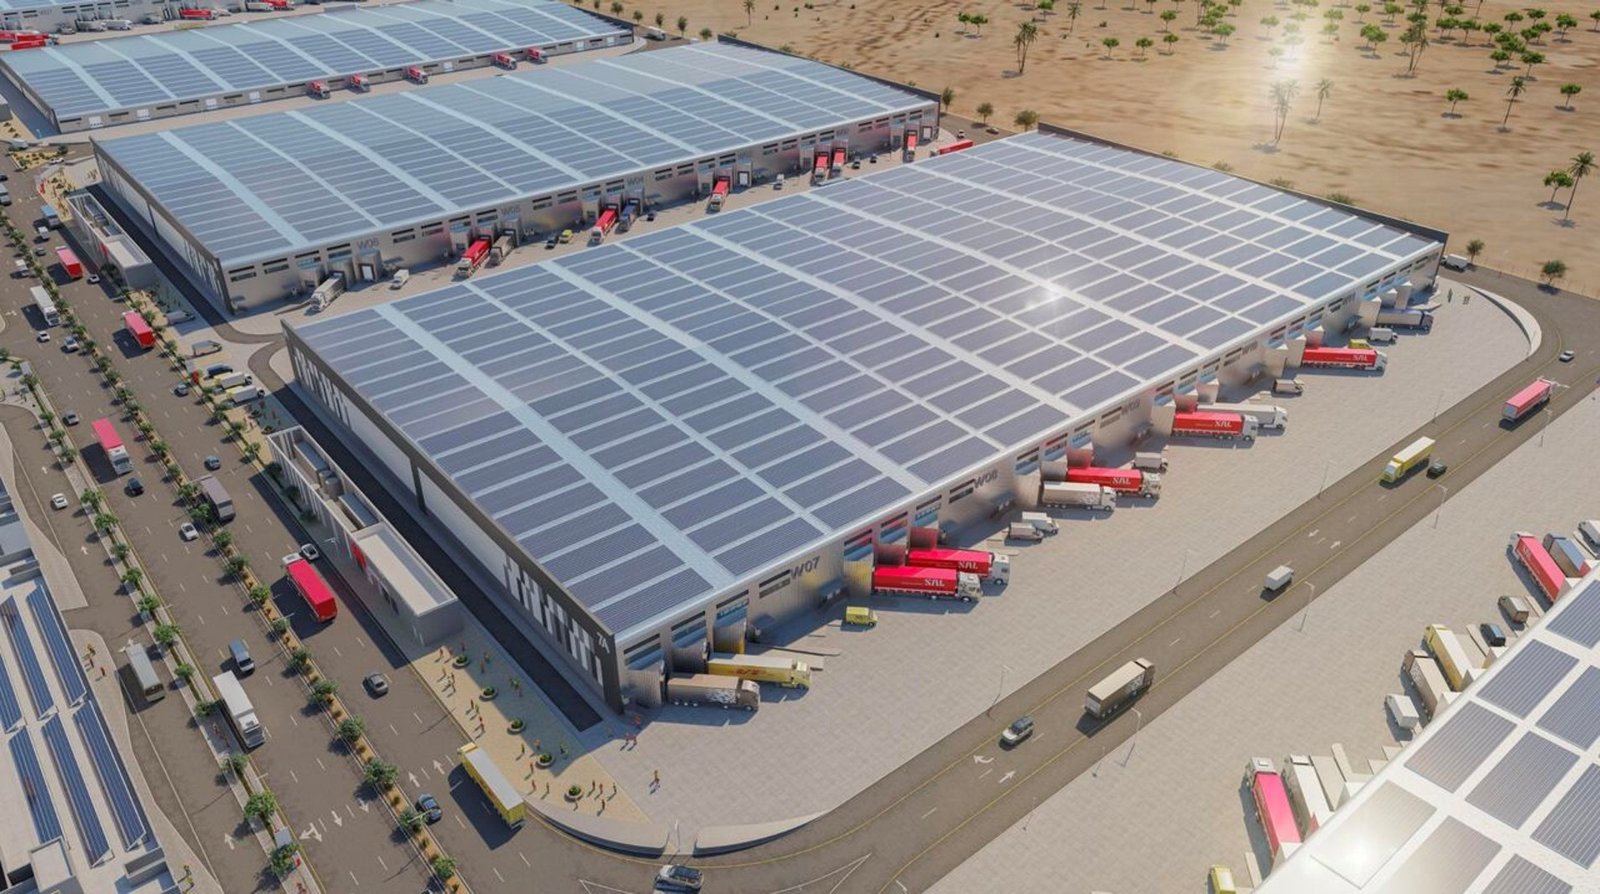
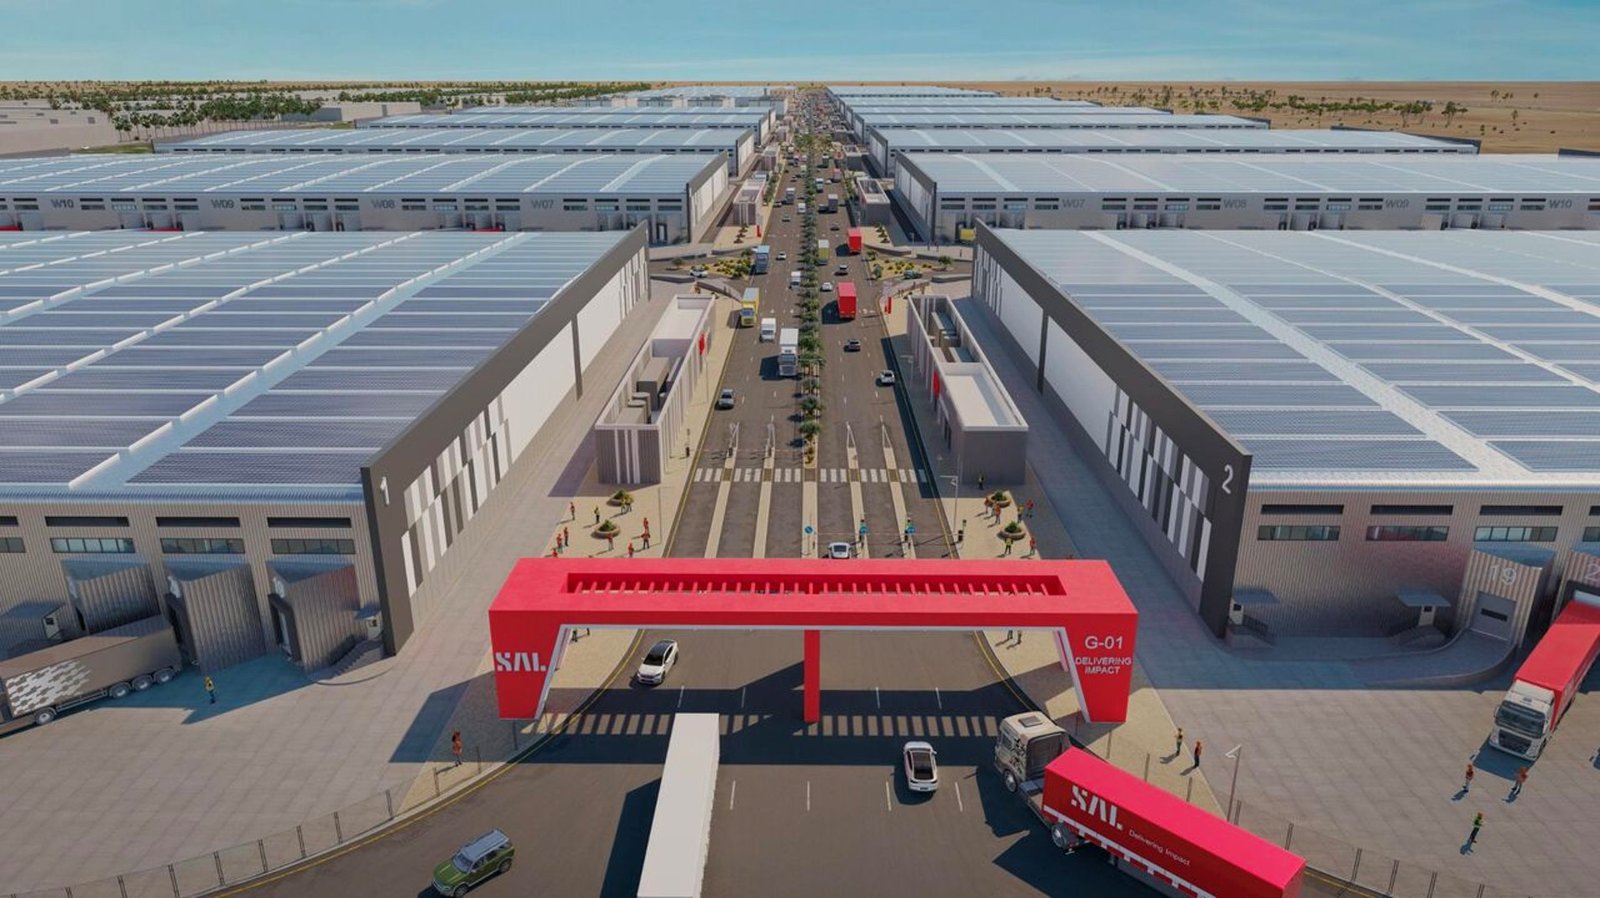
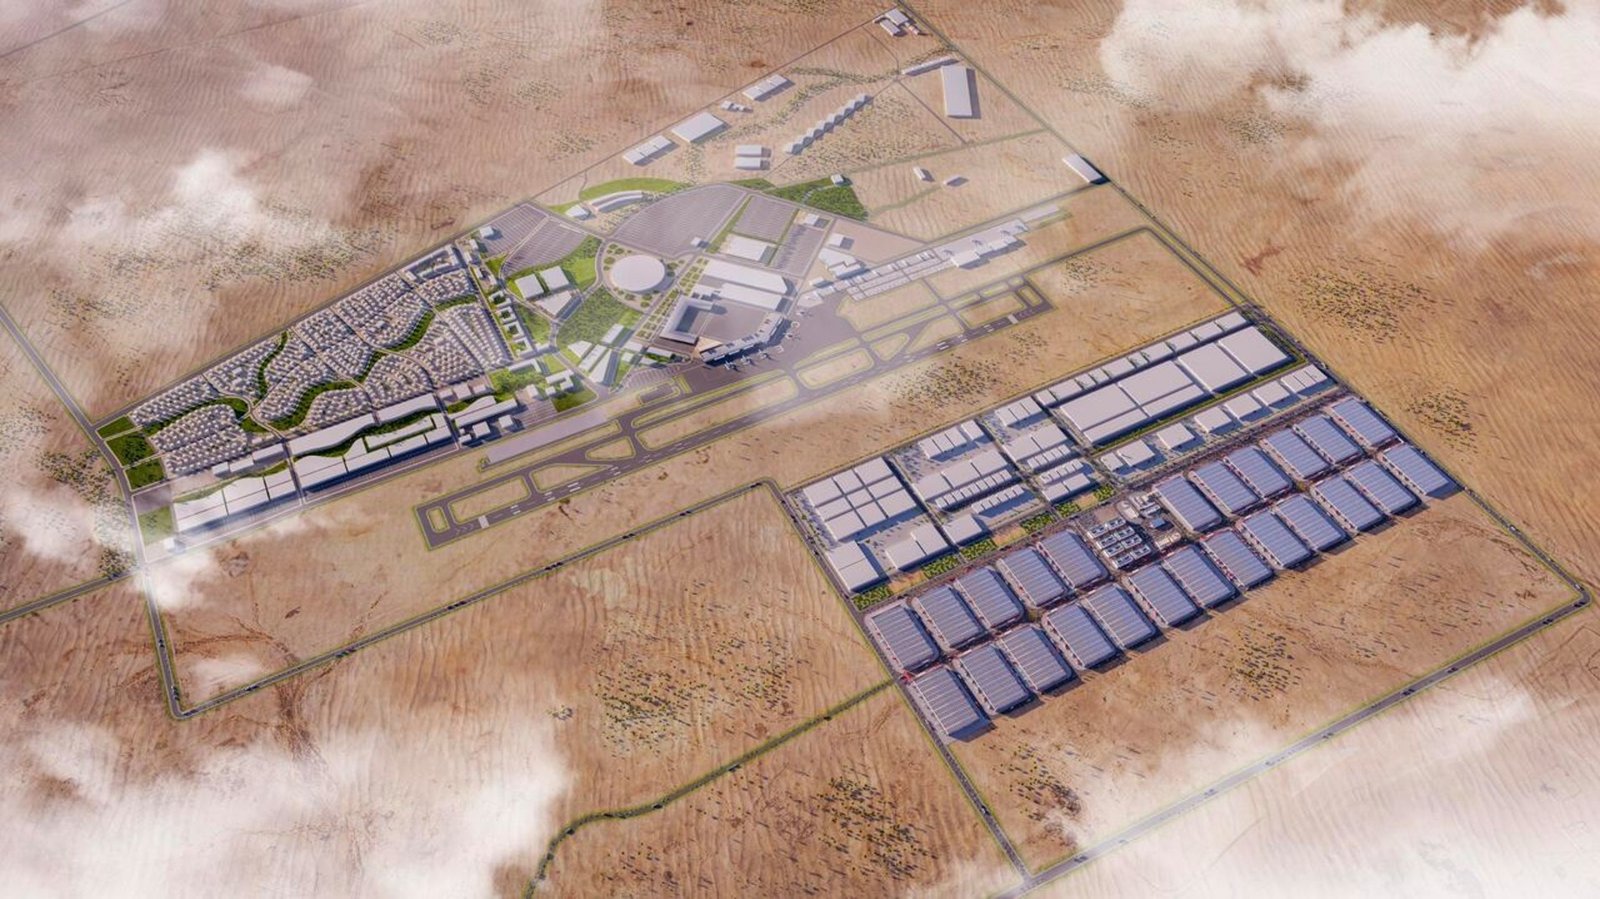
Figure 1.1
SAudi's warehousing market
I am going to use the data given by Knight Frank for the representation of how undersupplied Saudi is when it comes to warehousing supply. Keep it mind that the report was based on H1 2025, therefore further developments within the Kingdom might have taken place. However, the general concepts and data will remain relatively the same because catering to the market’s great deficit of supply will take years. In order to lower the gap between supply and demand requires substantial infrastructure investments.
Vision 2030 has been a great catalyst for the growth of logistics within Saudi as they plan to make Saudi a logistics hub. Roughly 2/3 of the world’s population is within 8 hours flight to Saudi. Furthering their diversification into non-oil industries, logistics remain at the frontier of priorities because it is what connects the products from manufacturing to end-user. And with Saudi’s focus on growing its local manufacturing footprint, logistics will play an even greater role in providing the required network of players to aid local manufacturers. The goal is for Saudi to have logistics be 10% of GDP up from 6% in 2025. Taxes levied on undeveloped residential land has been raised from 2.5% annually to 10% annually. Programs like these drive the development of logistics as it discourages hording. And these programs increases the value of Saudi’s assets through enabling productive use.
During the first half of 2025, Riyadh’s warehousing stock increased 3.5% to 28.9 million sqm showing strong growth. Jeddah saw similar growth albeit a little lower than Riyadh and has warehousing stock of 16.2 million (+1.4%) by H1 2025. I will be focusing on Riyadh and Jeddah as they have the largest leasable area and hold the most importance in the development of future warehousing. Figure 1.2 shows that Riyadh and Jeddah cumulatively hold close to 50 million sqm of warehousing stock.
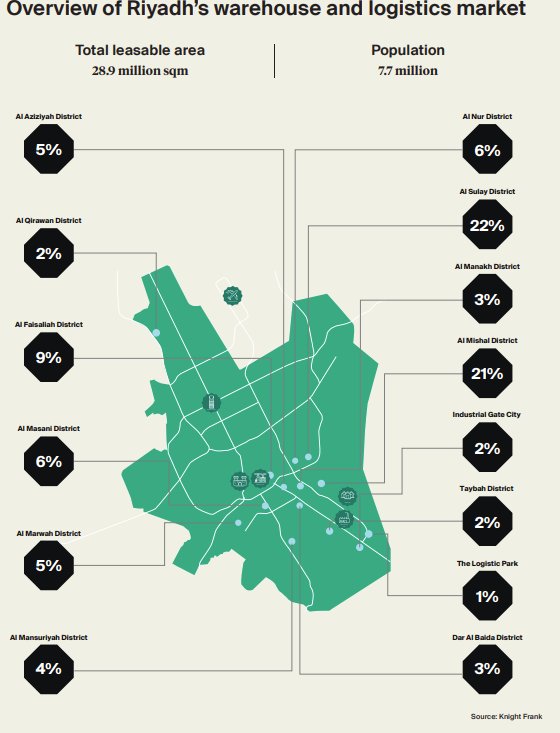
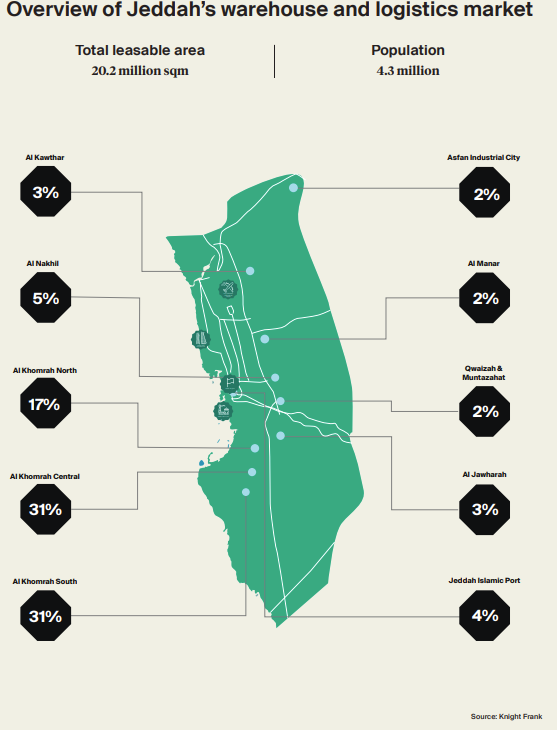
Figure 1.2
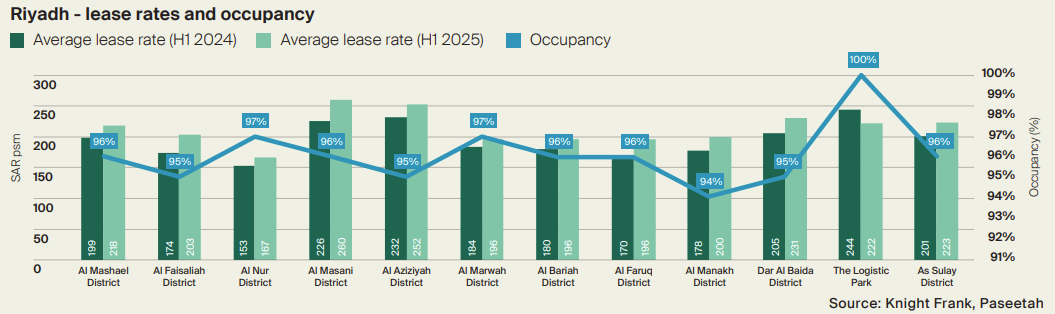
Fueling growth is demographic shifts, rising female workforce participation, urbanization, and tech savvy youth pushing and accelerating the e-commerce sector. This drives the need for warehousing and distribution centers in order for smooth logistics and delivery services. In Riyadh, specialized facilities such as cold storage is becoming more important as pharmaceutical and food supply grows. Additionally, Riyadh have seen major investments from foreign companies for the construction of data centers and cloud infrastructure. Rental rates for Riyadh grew a whopping 16% in H1 2025 compared to the previous year. The citywide rental rate sat at SAR 208 psm (per square meter). Overall occupancy reached 98%, showing the large demand for these infrastructure in the region. Figure 1.3 shows the different districts and their SAR per square meter (psm) and their respective occupancy rate. Prime warehousing assets reached SAR 250 psm. The premium reflects the scarce supply of higher quality warehousing. However, lower quality warehousing saw lower rental rate growth of around 4-5% as landlord focuses on lowering their vacancy rate.
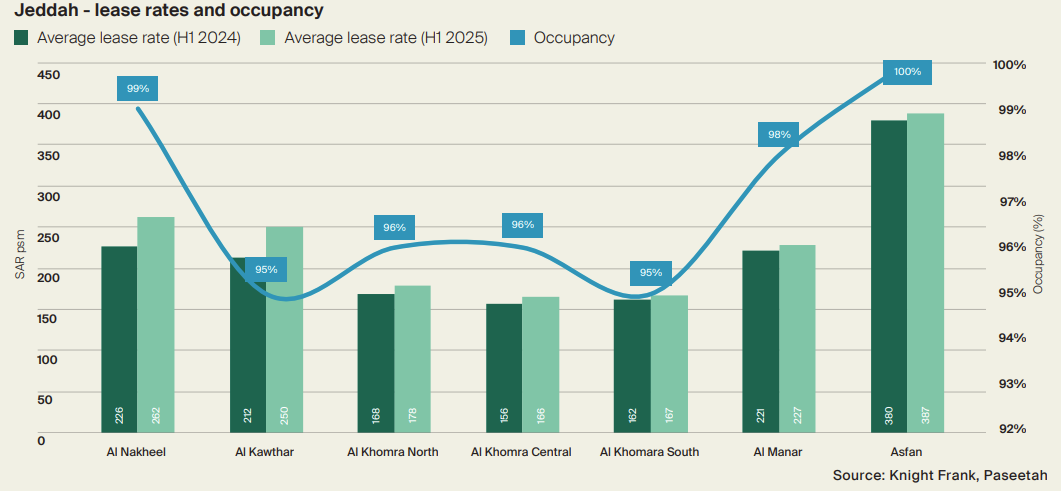
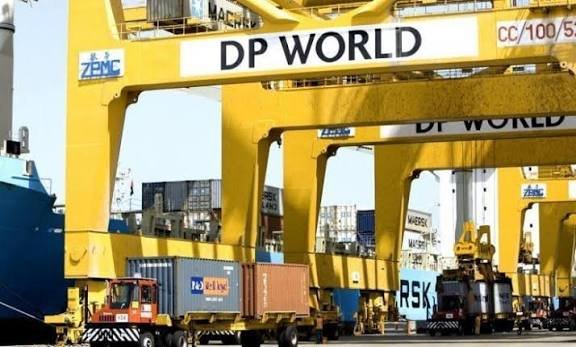
On the other hand, Jeddah is strategically located for the transport of ships to the Red Sea through their Jeddah Islamic Port. This gateway to the Red Sea serves as the Kingdom’s supply hub with many different goods being shipped everyday. Another unique attribute to Jeddah is that they see millions of Hajj and Umrah pilgrims every year which increases the demand for these infrastructure to support the high influx of people. The Al Khumra region dominates the total warehousing supply in Jeddah amounting to 79% of total supply. Overall occupancy rate for Jeddah in H1 2025 was a whopping 97%, despite the large growth in leasable area from the year prior. The average warehouse rent rose 8% in Jeddah in H1 2025. During this period the Jeddah Islamic Port has also seen large scale upgrades. DP World’s massive SAR 3 billion investment in Jeddah Islamic Port’s South Container Terminal resulted in the doubling of capacity to 4 million TEUs. Figure 1.5 shows the Jeddah Islamic Port and DP World’s investment into expanding their handling capacity. All these infrastructure-related investments further enhances Saudi’s attractiveness as a logistic hub.
As seen by the great growth in rental rates and the high occupancy rates, Saudi has not met their equilibrium in terms of warehousing stock. Demand exceeds supply and the logistics players that take the initiative to invest in this sector will likely see returns that are very appealing. Government support and incentives further boosts the sector’s growth. In the final segment of this post, I would like to share a detailed and more financial look on SAL Zones.
SAL Zones: a detailed look
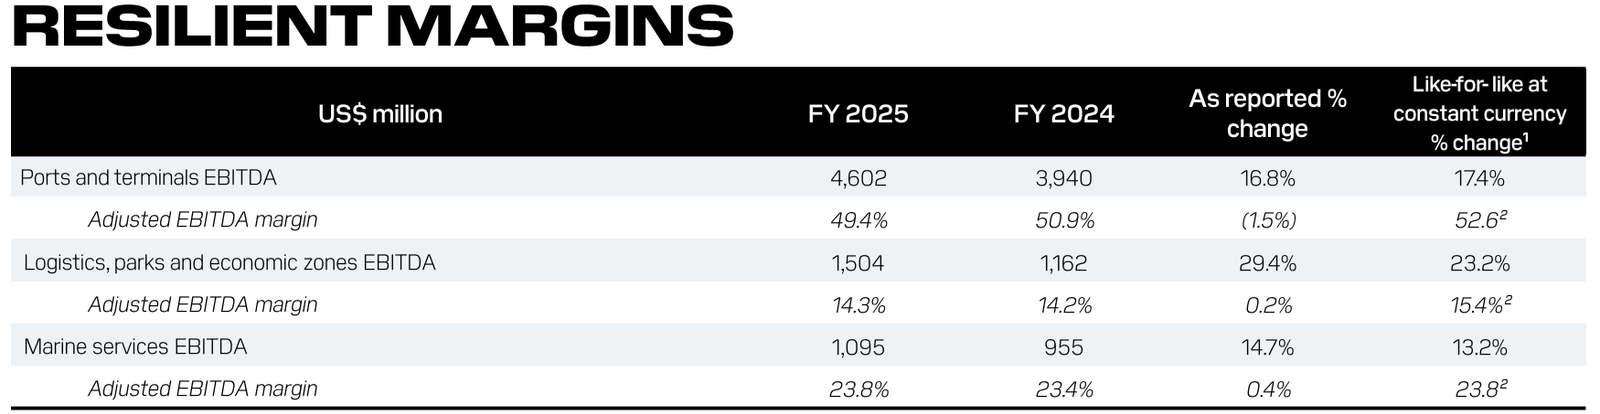
In this last section, I will mention a more technical and probably less beneficial information for the general reader. If you do not care much about the specifics and the company’s financials, proceed to the conclusion. SAL Zones have various comparable businesses under a large business entity. Each of the comparable businesses will differ in some ways. For example, DP World (main business is the management of ports around the world) does not breakdown its segment for logistics, parks and economic zones. Therefore, if our goal is trying to compare SAL Zones to DP World, it would not be possible as the segment is a mixture of 3 separate business with different economics. And I did not find how much each of the sub-segment is by percentage of segment. Therefore, logistics revenue may be 90% of logistics, parks, and economic zones revenue. Logistics margin tend to be on the lower side (low to mid single digit operating margins). In contrast the economic zones and logistic parks tend to be in the higher (high double digit operating margins). Figure 1.6 shows DP World’s margin breakdown by segments. I will take EBITDA as a proxy for their operating margins as EBIT or operating margins is not explicitly reported by the company. The Logistics, parks, and economic zones EBITDA is a measly 14.3% reflecting probable dilution of margins from logistics business mix. Therefore, DP World is not a great comparison for SAL Zones.
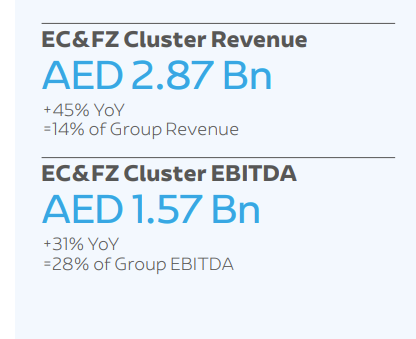
A closer representation to SAL Zones’ business segment could be AD Ports Group. Similar to DP World, AD Ports manages multiple ports and have various logistics services. Their EC&FZ segment is their economic cities & free zones, which has similar economics to SAL Zones in that there is minimal maintenance capital expenditure and revenue comes from rental from lessee. Figure 1.7 and 1.8 were extracted from the company’s annual report for the fiscal year 2025. Their EC&FZ revenue is large at AED 2.87 billion in 2025. This is larger than what SAL Zones is expected to bring in by 2030. However, it serves as a great comparable. Again, the company does not break it down by EBIT, so EBITDA will have to represent the operating performance of the business. And a whopping 49.2% in EBITDA margins signals the great economics of the business of warehousing and economic zones. It seems that the large barrier to entry for this business segment is the large initial capital outlay required for leasing or acquiring the vast amount of land needed to support the usable land area for warehousing. Additionally, AD Ports’ EC&FZ segment is very similar to SAL Zones in that they both focus in one country. However, the slight divergent to the similarity between the two companies’ businesses is that AD Ports’ EC&FZ includes residential related revenues compared to SAL Zones where almost all of the revenue is from industrial warehousing. Let us take a look on one last example which I believe best represents SAL Zones business.

Agility’s ALP or Agility Logistics Parks reflects a business economics very similar to SAL Zones. They are even similar in scale in that built-up-area (BUA) is around 900k sqm which is close to that of what SAL is expected to have when the project is done. Additionally, Agility mainly operates in Saudi and also focused on offering Class A warehousing. Therefore, the premium rental rates attached to Class A warehousing would mean that the operating performances of Agility’s ALP and SAL Zones would be very similar. However, Agility ALP has some operations in India and Africa. Figure 1.9 shows that the operating margin (using EBITDA due for the sake of comparison since the other businesses do not share their EBIT) is north of 80%. Before we get deep into the numbers in SAL Zones and their expected operating results, it is worth to note that they expect an EBITDA margin of around 80% for their Zones segment. This is very close to the operating results of Agility ALP.
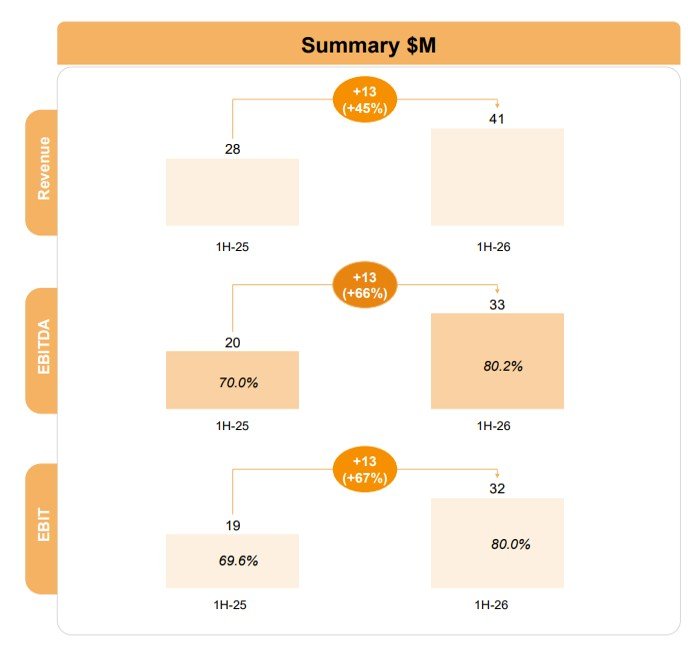
Information of SAL Zones and expected operating results were shared by SAL’s management through their capital markets day 2025 presentation. The SAR 4.1 billion spend on CAPEX will increase SAL’s warehousing space by ~890k sqm and will contribute ~SAR 400 million. Since the usable or BUA is around 890k sqm and the leased land is around 1.5 million sqm, SAL Zones will have a BUA/Land area ratio of ~59%. Next, let’s try to estimate their revenue psm (per square meter) which gives us a rough estimate on the pricing of the rentals compared to the average prime asset warehousing today in Riyadh of SAR 250 psm. Since the expected revenue is SAR 400 million, then we can just take SAR 400 million and divide it by BUA of 890,000 sqm. The revenue psm or rental rate is around SAR 450 psm. This means that the prime asset rental rates in Riyadh must grow at a CAGR of 12.5% for 5 years till 2030 for the rental rate to grow from SAR 250 psm to SAR 450 psm. This estimation seems to be supported by the fact that Agility ALP’s estimated 2026 revenue psm is higher than the average Riyadh prime asset rental rate. Their estimated revenue exit rate for 2026 is $95 million, equivalent to SAR 356 million. And they expect to reach a BUA of 960k sqm in KSA. As KSA is their primary region, they do not breakdown the other regions’ BUA, therefore the revenue psm is calculated on KSA’s BUA rather than the global portfolio. However, because their largest BUA is in Saudi, we can take this as a proxy for their portfolio BUA. This computes to a revenue psm or rental rate of SAR 371 psm. Which is not far from SAL Zones’ estimated SAR 450 psm.
My intention of computing the assumed growth in rental rates by using SAL’s estimated numbers is to question if management is being too optimistic or unrealistic with the projections. However, it seems that the rental rate of SAR 450 psm is in line with what the market can achieve as the importance of Class A warehousing increases. And when comparing with Agility ALP’s SAR 371 psm in revenue, it does not seem far fetched that SAL can achieve the estimated revenue psm.
With the ever increasing demand for warehousing space, SAL’s investment into Zones provide many secular tailwinds that will likely increase the value-added by the business. Having a more connected Kingdom, SAL places priority in the build out of high quality infrastructure to support the need of the Kingdom. With geopolitical tensions on the rise, markets rewards redundancy. Therefore, having multiple logistical check points builds a cohesive interdependence amongst logistics players and manufacturers. The importance of building a self sustaining Kingdom (i.e. food supply and pharmaceutical supply) is further exacerbated by the ever increasing frequency of geopolitical uncertainties. SAL Zones is set up to be a beautiful success story for KSA, showing what is possible when government and people work together to deliver impact.
Prior to posting this I had personally put in 155 hours of research in SAL.
Enjoy and feel free to leave a comment.